Coach Tips
Can wearing lower extremity compression garments improve time-trial performance in runners? A systematic review and meta-analysisPublished on September 18, 2022
Michael Rosenblat, PT, PhD, CEP
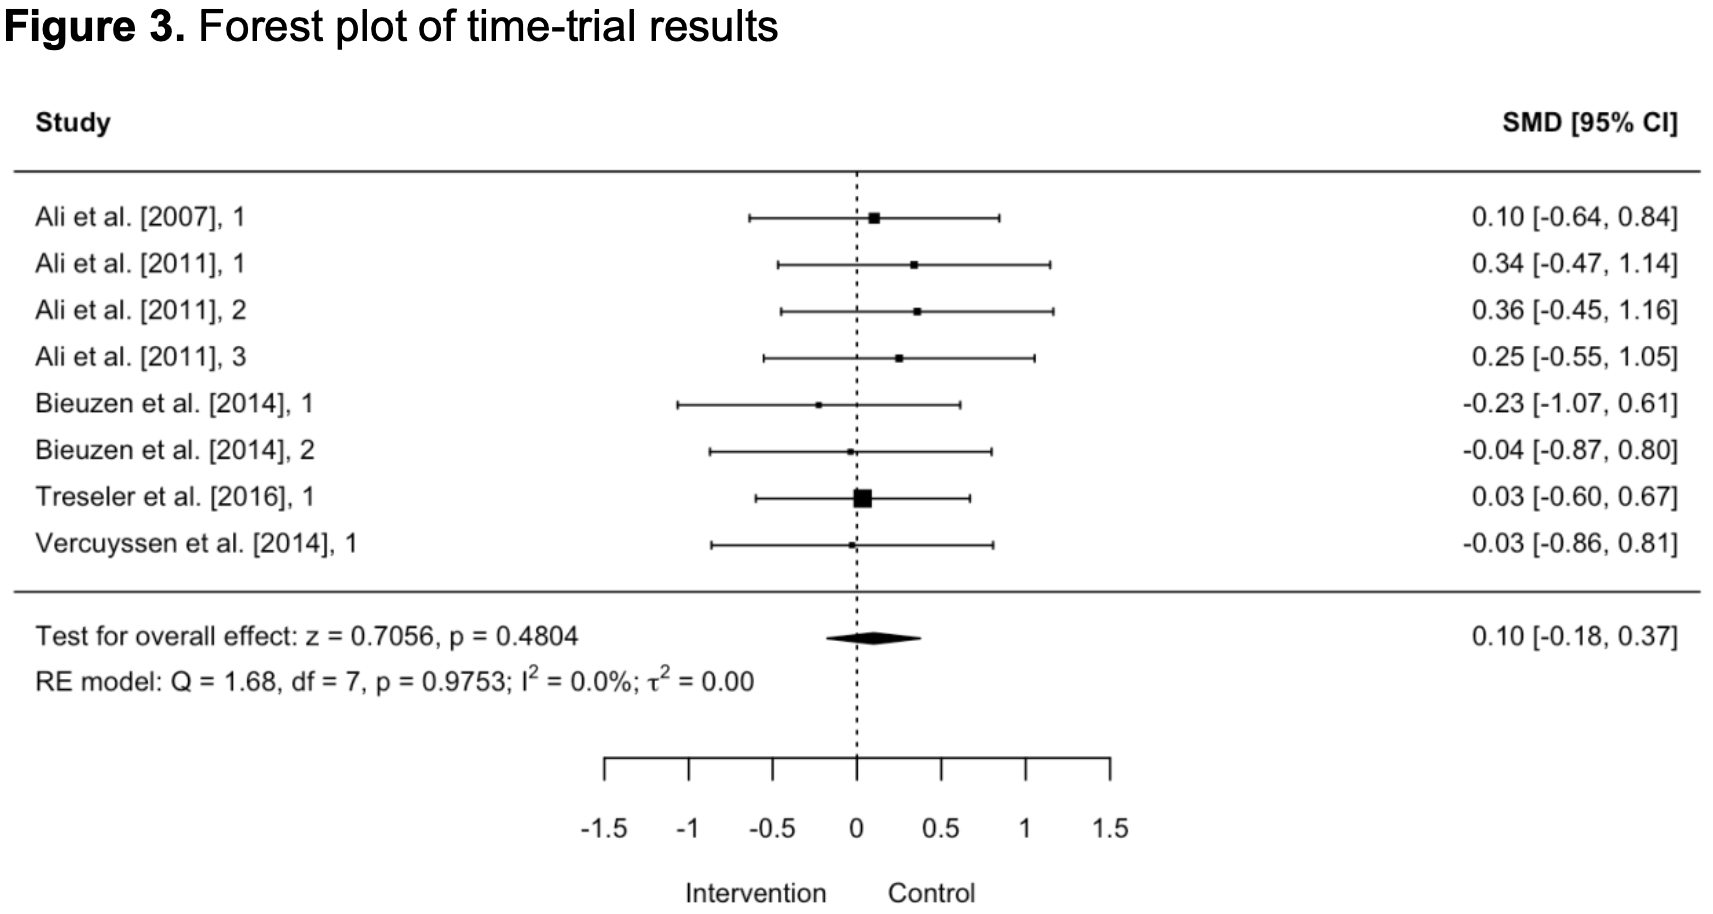
ABSTRACTThe objective of this review was to determine the effect of wearing lower extremity CGs during running on TT performance in runners. Studies were included in the systematic review if they met the following criteria: 1. peer reviewed, academic journals, 2. published in the English language, 3. randomized crossover studies, 4. included runners, 5. included CGs that were at or below knee height, 6. included a placebo trial, and 7. included a TT of a set distance. Two databases, Medline (Ovid) and SPORTDiscus (EBSCOhost), were used to conduct an electronic search including all publication years (i.e., from inception) up to and including September 5, 2022. A total of 12 full-text articles were retrieved. Five articles were included in the quantitative analysis. All studies included a randomized crossover design. They included a total of 67 (male and female) participants. The mean age and V̇O2max ranged from 20 to 34.7 years and 55.0 to 68.7 ml×kg-1×min-1. The compression garments were all below knee height. The TT tests ranged from 5.0 km to 15.6 km and were completed in a variety of settings including road, track, and trail. The pooled analysis indicated that there was no statistically significant difference in TT performance between CG and control (SMD = 0.10, 95% CI = -0.18 to 0.37, p = 0.4804). Wearing lower extremity CGs does not improve TT performance in runners.
1 INTRODUCTION1.1 BackgroundA lower extremity compression garment (CG) can be used to apply mechanical pressure to the body surface by compressing the underlying tissues [1]. Lower extremity CGs are commonly used for patients with cardiovascular disease. However, lower extremity CGs are also used by athletes as an ergogenic aid.
Time-trial (TT) tests are used to predict race performance and to evaluate the effectiveness of a training program. They can be completed in either a laboratory or a field environment. The most common type of TT test is one that requires an individual to complete a set distance (e.g., 10-km) in the fastest time possible. 1.2 ObjectiveTo determine the effect of wearing lower extremity CGs during running on TT performance in runners.
2 METHODSThe Cochrane Handbook for Systematic Reviews of Interventions was used to develop our methodology [2]. The findings were reported as per the 2020 PRISMA statement [3] with guidance from the PERSiST elaboration guidelines for systematic reviews in exercise science [4].
2.1 Eligibility CriteriaStudies were included in the systematic review if they met the following criteria: 1. peer reviewed, academic journals, 2. published in the English language, 3. randomized crossover studies, 4. included runners, 5. included CGs that were at or below knee height, 6. included a placebo trial, and 7. included a TT of a set distance.
Studies were be excluded for the following reasons: 1. the full text article is unavailable, 2. participants had pathology, 3. the CGs were above knee height, 4. the CGs were not worn during the TT, 5. the study contained nutritional interventions (supplements, hydration, fed state, etc.), 6. participants were subject to changes in environmental conditions (heat, cold, altitude, hypoxia, hyperoxia, etc.), 7. inclusion of other modalities (cryotherapy, etc.), 8. included pharmacological agents, and 9. the study did not include group means with accompanied standard deviation (SD) or standard error of the mean (SEM) for the primary outcome. 2.2 Information SourcesTwo databases, Medline (Ovid) and SPORTDiscus (EBSCOhost), were used to conduct an electronic search including all publication years (i.e., from inception) up to and including September 5, 2022.
2.3 Search strategyThe search strategy follows a PICOS style approach, excluding study design and outcomes to ensure that a broad and inclusive search will be conducted. The search strategy included a list of synonyms and tenses for relevant interventions and outcomes. The search limits were set to the following: titles, abstracts, English language, and academic journal articles. Below are the search terms.
2.3.1 Search Terms(running OR runners OR marathon OR marathoners OR ultramarathon OR ultramarathoners OR track athletes OR ("track and field") OR sprinters OR sprint athletes OR sprinting OR joggers OR jogging OR cross-country OR cross country)
(compression garment OR compression garments OR compression stocking OR compression stockings OR compression clothing OR elastic garment OR elastic garments OR elastic stocking OR elastic stockings) 2.4 Selection ProcessA single reviewer independently completed two levels of article screening (1. title and abstract, and 2. full-text) and abstracted data from the full-text articles.
2.5 Data Collection ProcessOne reviewer independently extracted the data from each of the studies. When multiple studies report data from the same study population, the publication with the earliest date was considered the primary publication. Whenever possible, Plot Digitizer (https://plotdigitizer.com) was used to extract data from figures that was not otherwise available in the text or tables of the respective articles.
2.6 Data ItemsData for the following categories were extracted: study design, participant baseline data (means, SD, and/or SEM), intervention and comparator characteristics, and outcome details were extracted.
2.7 Study Risk of Bias AssessmentCochrane Collaboration Risk of Bias 2.0 Tool was used to determine the level of bias in intervention studies [5]. One reviewer independently assessed the individual articles.
2.8 Effect MeasuresThe primary outcome assessed in the review was the standardized mean difference in TT completion time (sec) between the compression trial(s) and the control trial. TT completion time is a continuous variable and was expressed in seconds.
2.9 Synthesis MethodsData synthesis was performed for the standardized mean difference (SMD) in TT performance between the compression garment trials and the control trials. The SMD was used because the studies included TT that were different distances.
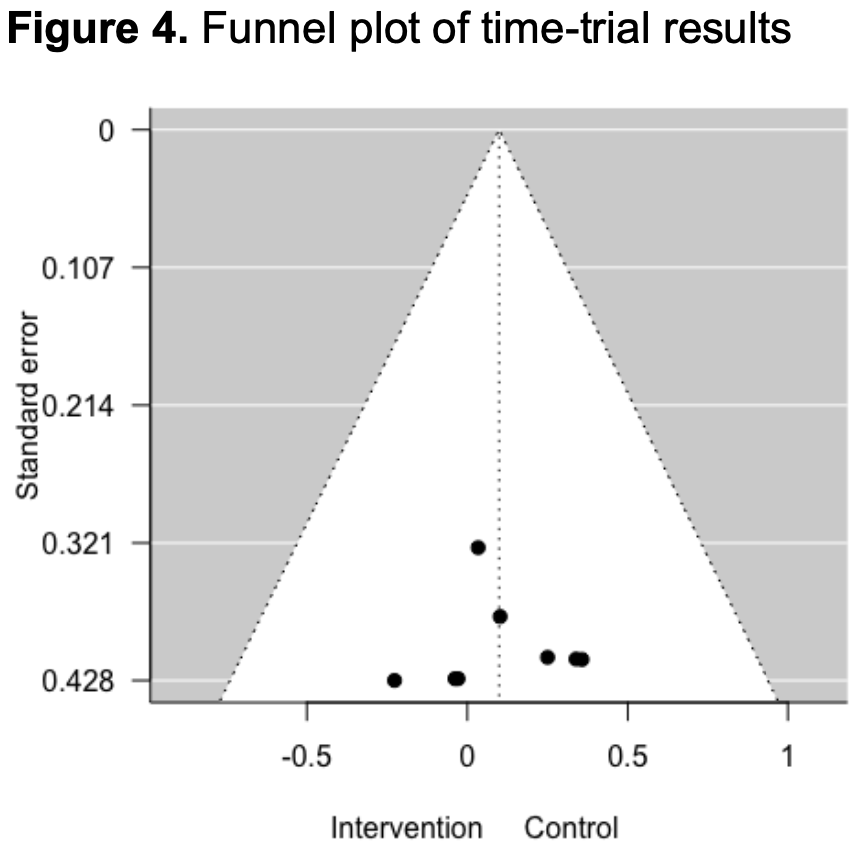
Data conversions were performed to determine values for missing data as well as to standardize scores to allow for a consistent interpretation of the results. Data expressed using the standard error of the mean (SEM) were converted to a standard deviation (SD) using the following formula: SD = SEM×sqrt(n); where n represents the sample size of the group. The mean difference for TT was pooled using the metafor package (version 2.4-0) in R (version 4.0.2) using a random effects model and the DerSimonian-Laird estimator. The I2 statistic was used to describe the degree of statistical heterogeneity by determining the percentage of the total variation in the estimated effect across studies. I2 values of 25%, 50%, and 75% were considered as low, moderate, and high degrees of statistical heterogeneity [6]. 2.10 Reporting Bias AssessmentThe relationship between the effect size and the sample size was determined visually using a funnel plot. Egger’s test was used to quantitatively assess for small sample size bias [7].
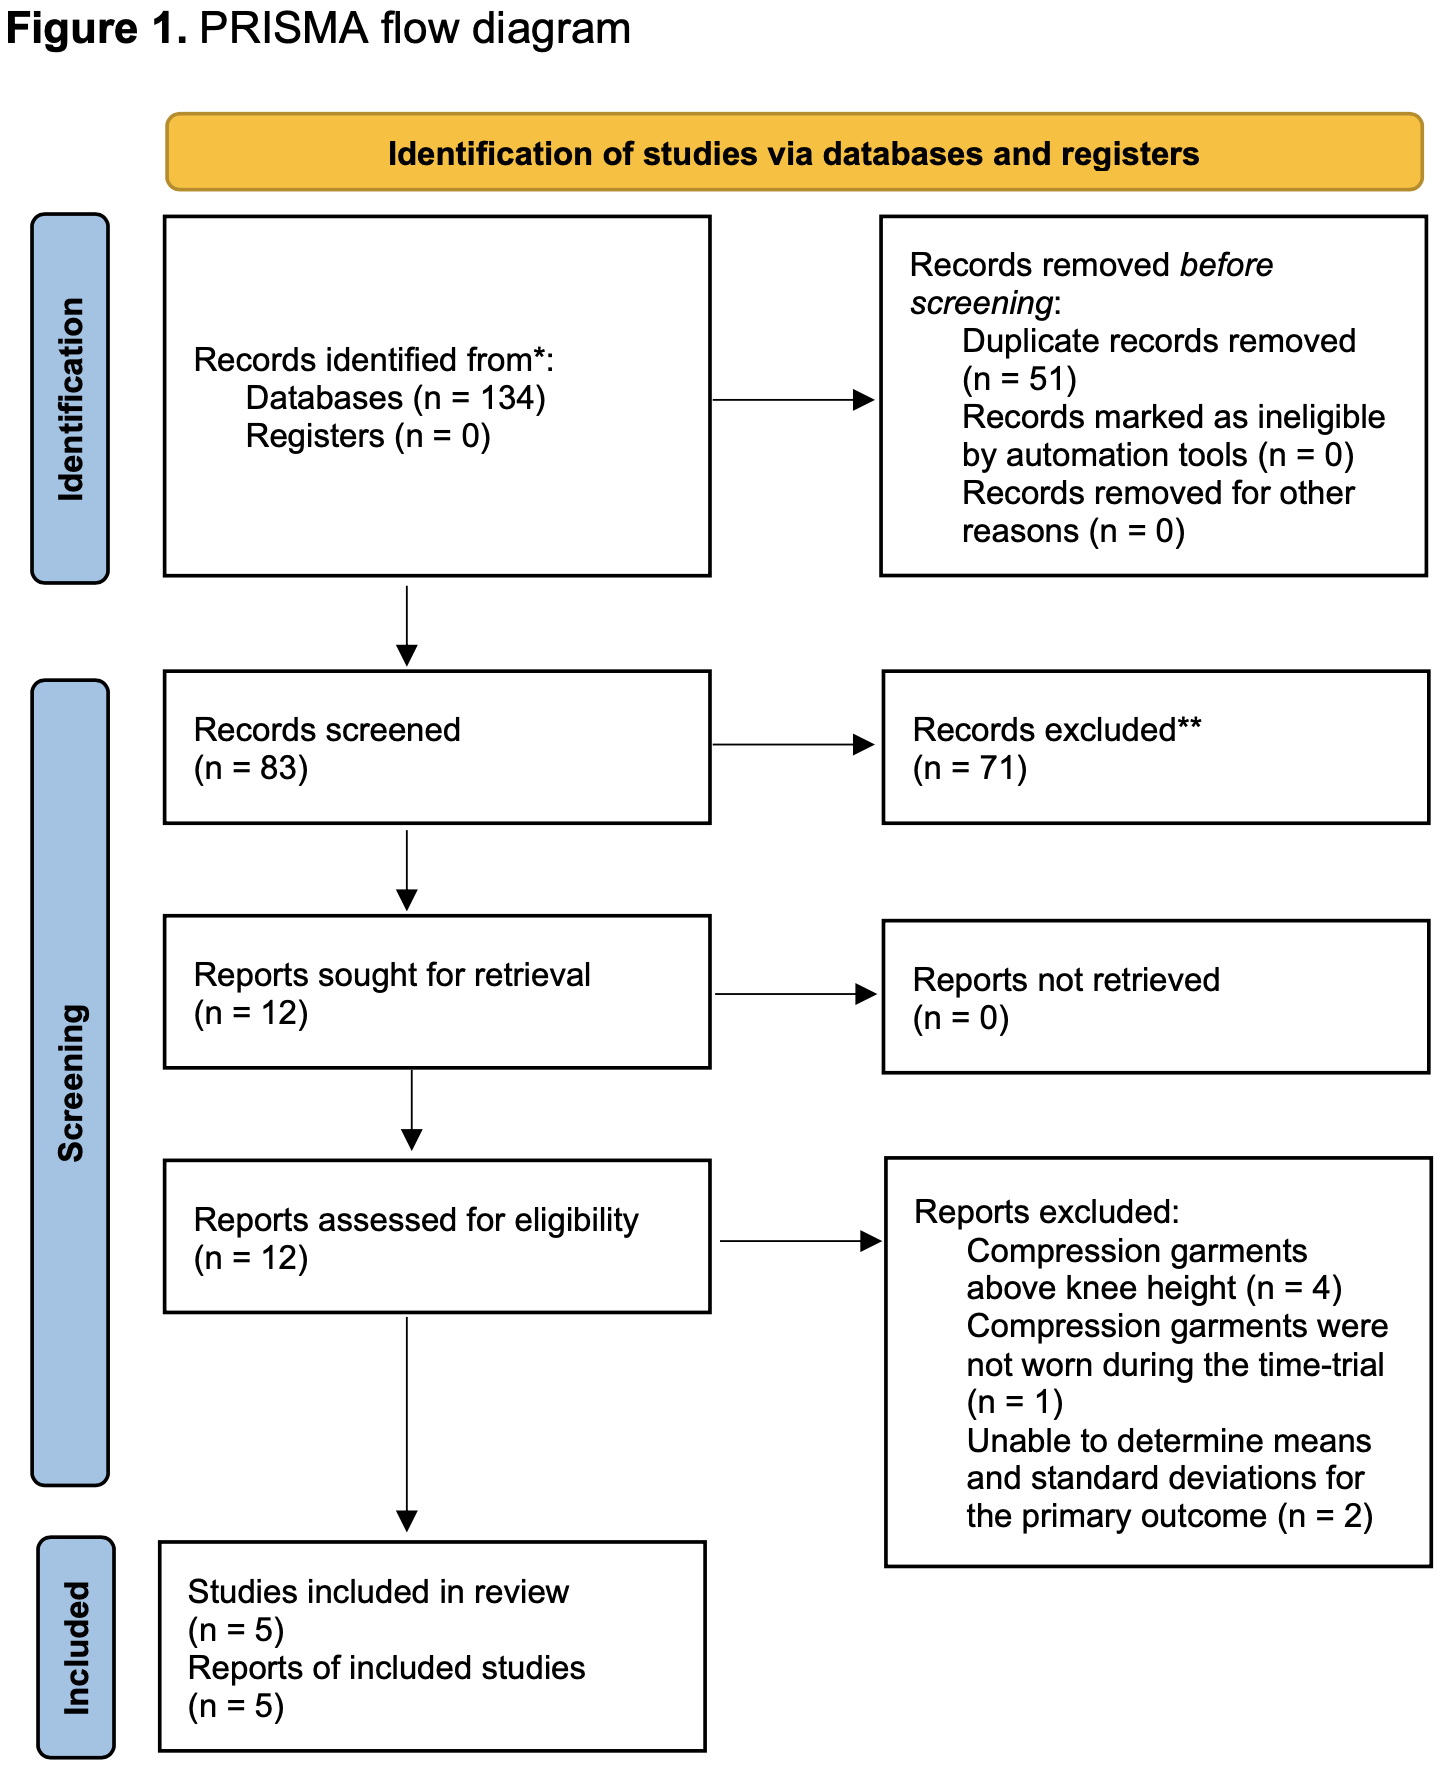
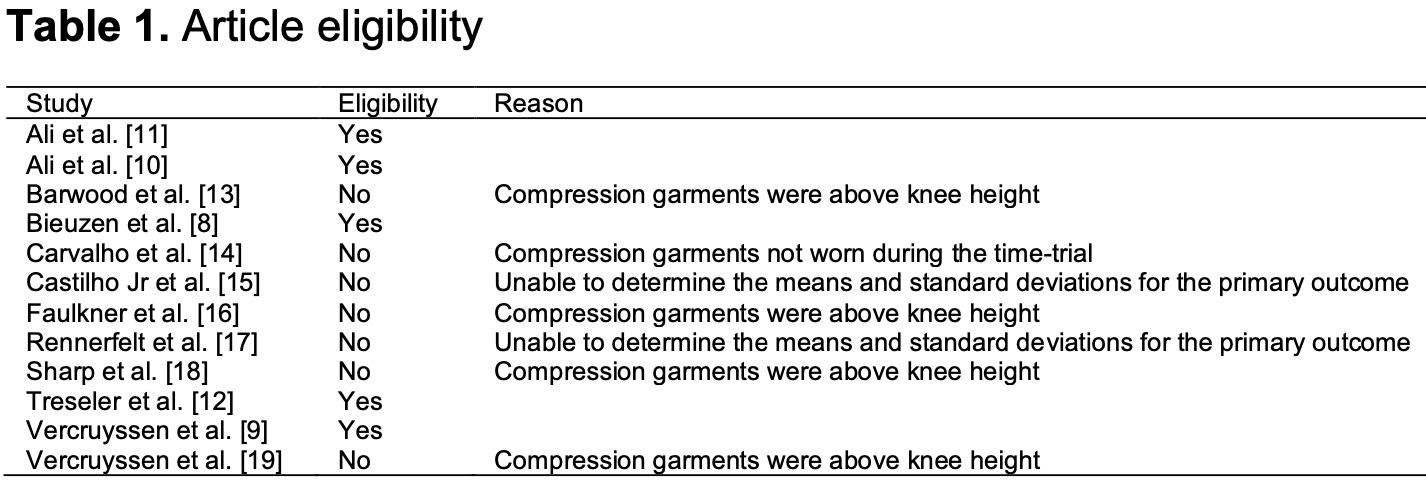
3 RESULTS3.1 Study SelectionA total of 134 records were identified by searching Medline (Ovid) and SPORTDiscus (EBSCOhost). See Figure 1 (click here). After removing duplicates and screening titles and abstracts a total of 12 full-text articles were retrieved. Five articles were included in the quantitative analysis. See Table 1 (click here). Two studies [8, 9] included the same participants; however, used different CGs for the intervention trials. Therefore, they were counted as separate studies.
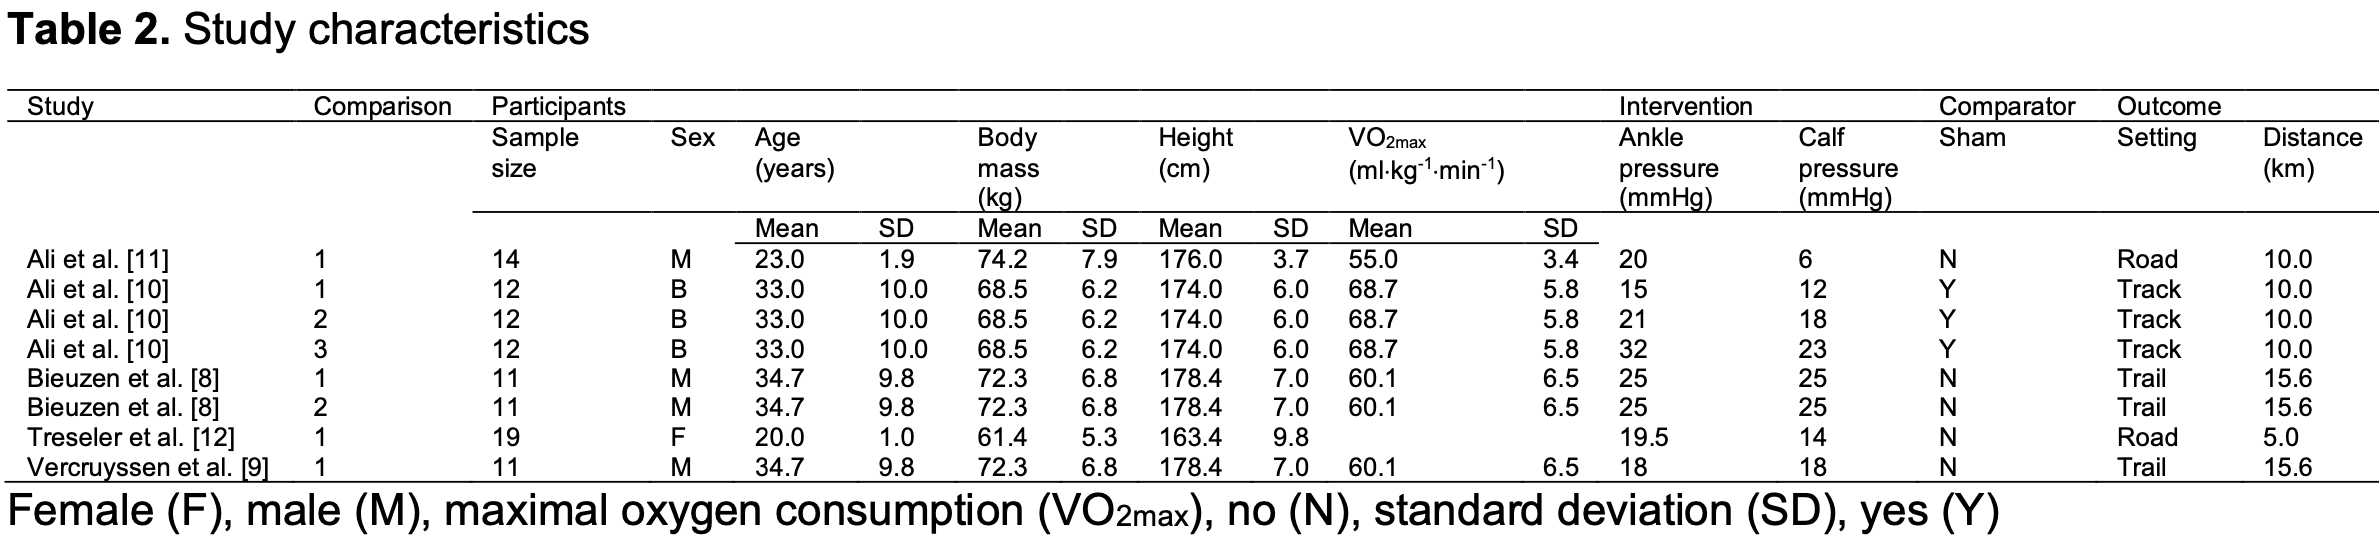
3.2 Study CharacteristicsAll studies included a randomized crossover design. There was a total of 67 (male and female) participants. See Table 2 (click here). The mean age and VO2max ranged from 20 to 34.7 years and 55.0 to 68.7 ml×kg-1×min-1. The compression garments were all below knee height. The TT tests ranged from 5.0 km to 15.6 km and were completed in a variety of settings including road, track, and trail. Participants all completed at least one familiarization TT test.
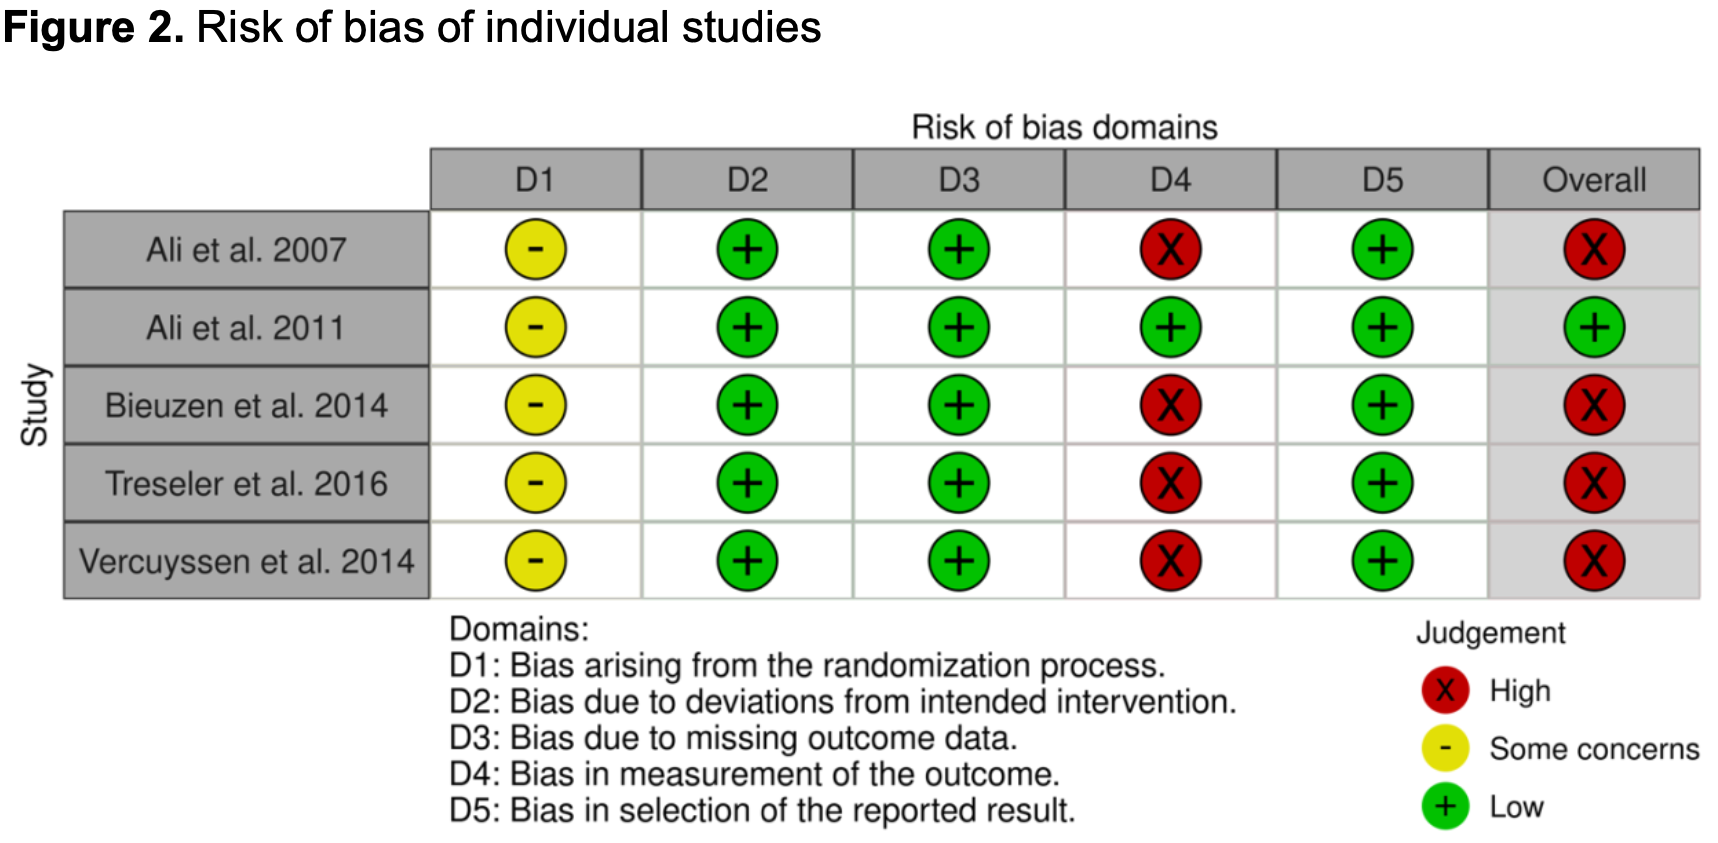
3.3 Risk of Bias in StudiesOnly 1 of the 5 included studies [10] included a sham garment for the control group. Therefore, there was an overall high risk of bias. See Figure 2 (click here).
3.4 Results of Individuals StudiesThe results of the individual studies can be found in Table 3 (click here).
3.5 Results of SynthesesThe pooled analysis indicated that there was no statistically significant difference in TT performance between CG and control (SMD = 0.10, 95% CI = -0.18 to 0.37, p = 0.4804). See Figure 3 (click here). Furthermore, there was no evidence of statistical heterogeneity (I2 = 0%).
3.6 Reporting BiasThere was no indication of small sample size bias following visual inspection of the funnel plot or from the results of Egger’s test for funnel plot asymmetry (beta = 0.10, 95% CI = -2.84 to 3.03, z = 0.0022, p = 0.9982). See Figure 4 (click here).
4 DISCUSSION4.1 Limitations4.1.1 Evidence Included in the Review
4.1.2 Review Process
5 CONCLUSIONWearing lower extremity CGs does not improve TT performance in runners.
REFERENCES
|